

Elastic has announced that it would be donating its Universal Profiling agent to the OpenTelemetry project, setting the stage for profiling to become a fourth core telemetry signal in addition to logs, metrics, and tracing.
This follows OpenTelemetry’s announcement in March that it would be supporting profiling and was working towards having a stable spec and implementation sometime this year.
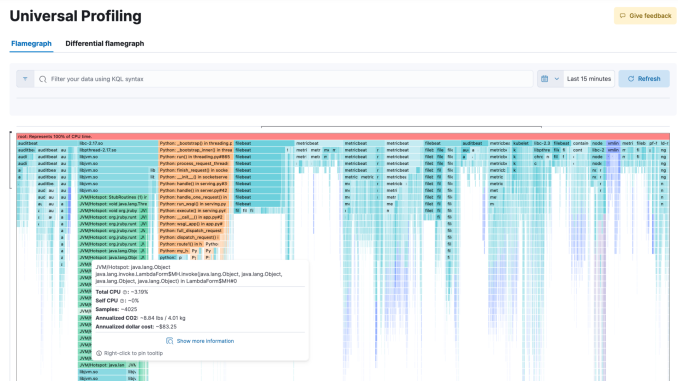
Elastic’s agent profiles every line of code running on a company’s machines, including application code, kernels, and third-party libraries. It is always running in the background and can collect data about an application over time.
It measures code efficiency across three categories: CPU utilization, CO2, and cloud cost. According to Elastic, this helps companies identify areas where waste can be reduced or eliminated so that they can optimize their systems.
Universal Profiling currently supports a number of runtimes and languages, including C/C++, Rust, Zig, Go, Java, Python, Ruby, PHP, Node.js, V8, Perl, and .NET.
“This contribution not only boosts the standardization of continuous profiling for observability but also accelerates the practical adoption of profiling as the fourth key signal in OTel. Customers get a vendor-agnostic way of collecting profiling data and enabling correlation with existing signals, like tracing, metrics, and logs, opening new potential for observability insights and a more efficient troubleshooting experience,” Elastic wrote in a blog post.
OpenTelemetry echoed those sentiments, saying: “This marks a significant milestone in establishing profiling as a core telemetry signal in OpenTelemetry. Elastic’s eBPF based profiling agent observes code across different programming languages and runtimes, third-party libraries, kernel operations, and system resources with low CPU and memory overhead in production. Both, SREs and developers can now benefit from these capabilities: quickly identifying performance bottlenecks, maximizing resource utilization, reducing carbon footprint, and optimizing cloud spend.”
You may also like…

